Impact Dashboard
Real societal impact takes years to surface. Until it does, the dashboard tracks paying customers, team size and external funding as the clearest near-term proxies.

Dutch universities turn researchers into founders.
The hard part isn't the science. It's proving the impact.
This dashboard makes it impossible to ignore.
Scientists on a mission.
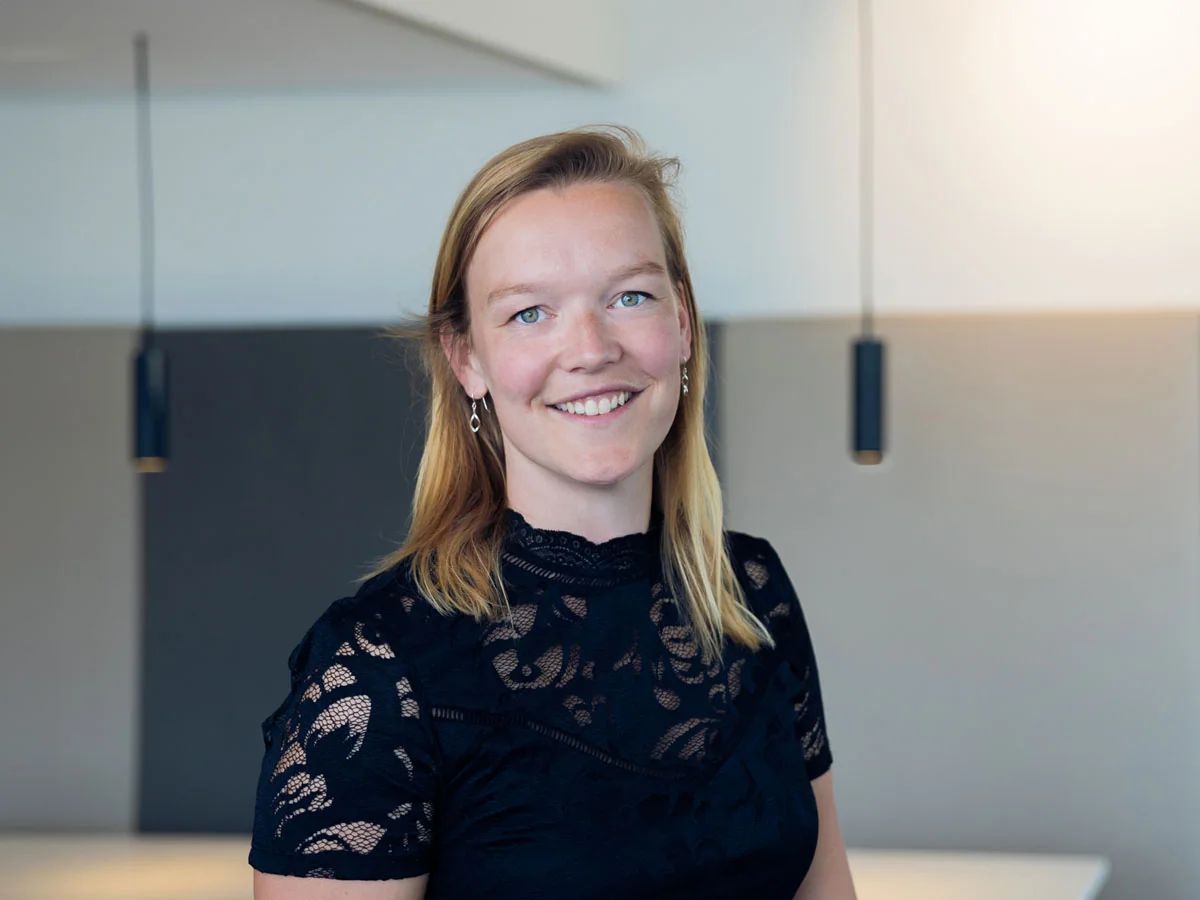
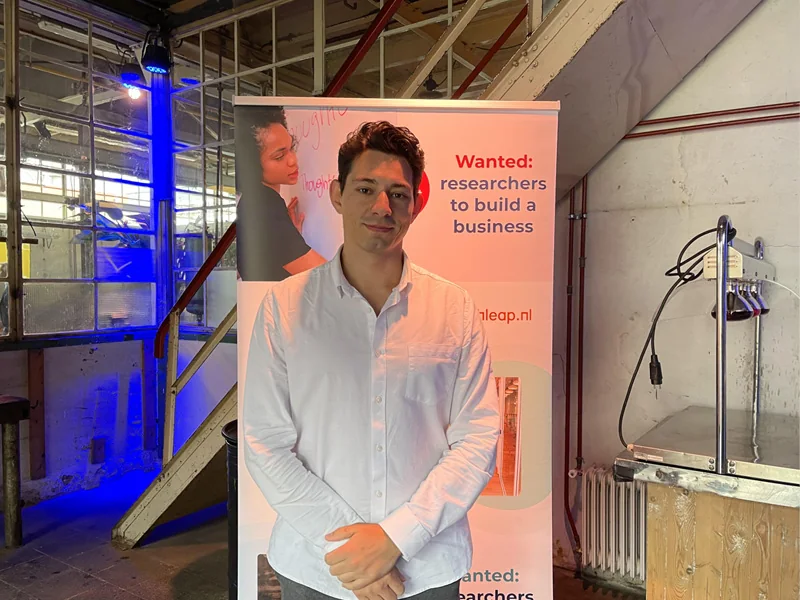
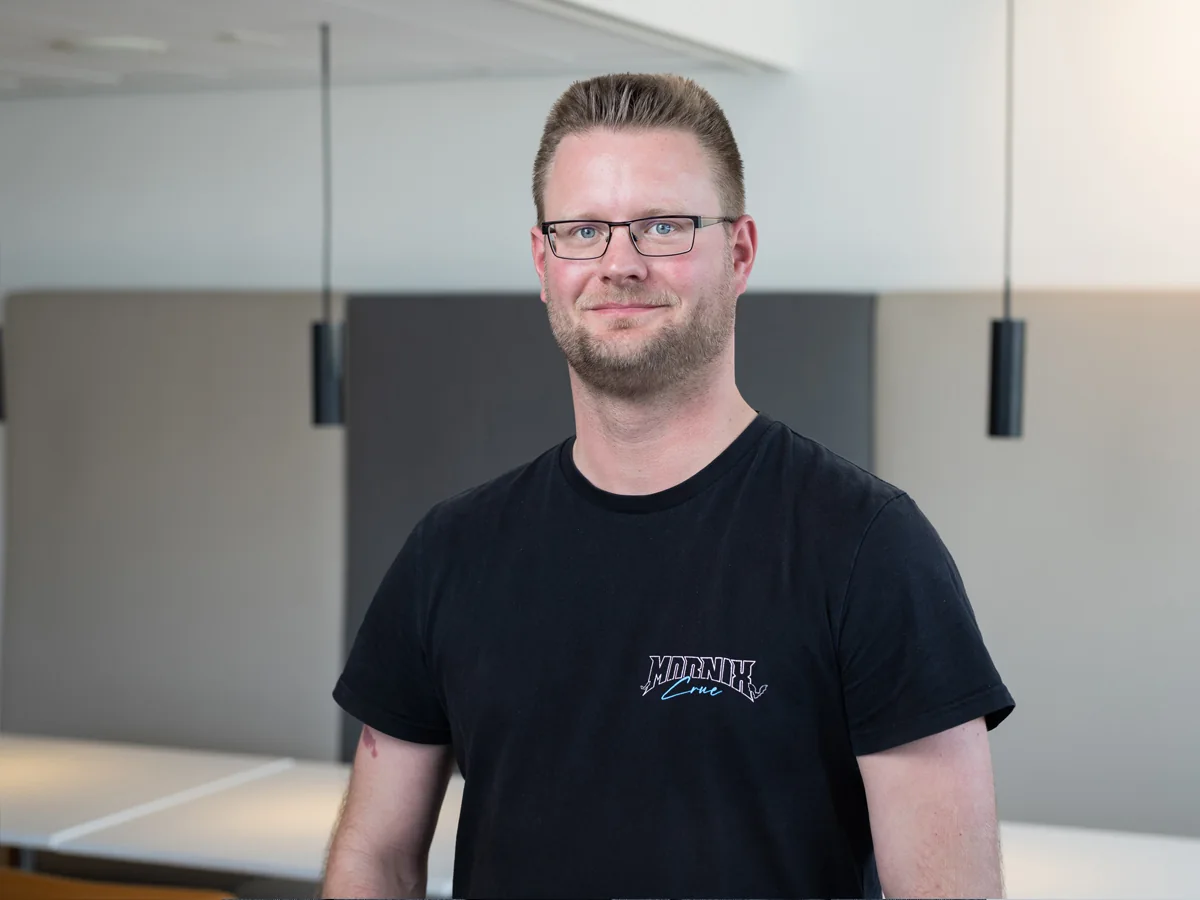
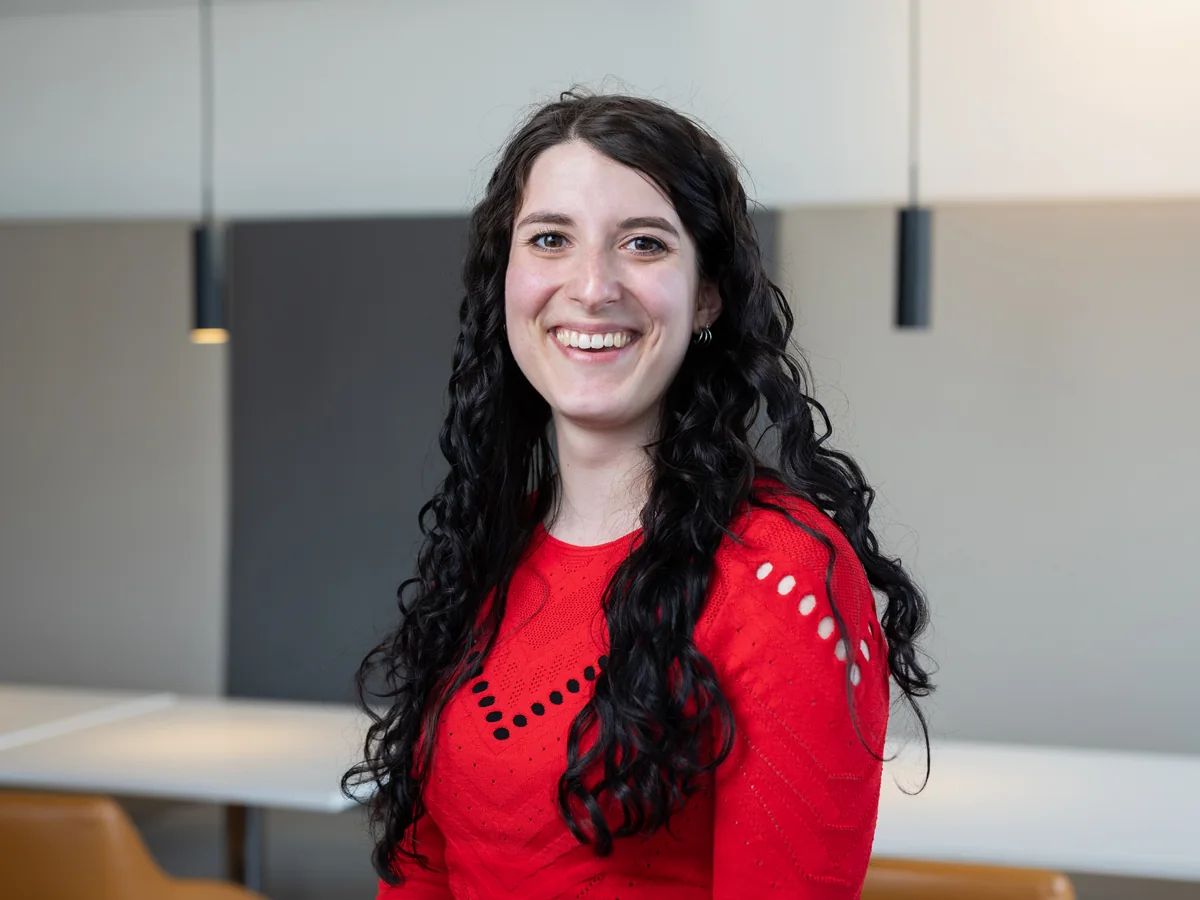
Behind every number is a researcher who left the lab to build. Ocean carbon capture, AI that reads cancer scans, fertiliser without the emissions. Here are the first three cohorts; cohort 4 lives in the live dashboard.































64,274 reached in one round. 52 chosen.
Every cohort starts wide: visitors from the recruitment mailing, application kit downloads, webinars, and then the applications the fellows are chosen from. Not every stage was measured for every cohort, so each number says which cohorts it counts.
Every milestone on the road to impact.
From the day a fellow is accepted to the day they exit, the dashboard follows eight milestones and shows how far the whole cohort has come on each one. Early, honest, and impossible to fudge.
Backed by the Netherlands' research system.
Sixteen universities, medical centres and institutes, four impact domains, and the national bodies that fund them. The dashboard rolls it all into one honest picture.









See where the impact stands today.
The dashboard is live and public. No login, no gate. Just the numbers, cohort by cohort.
Open the live dashboard